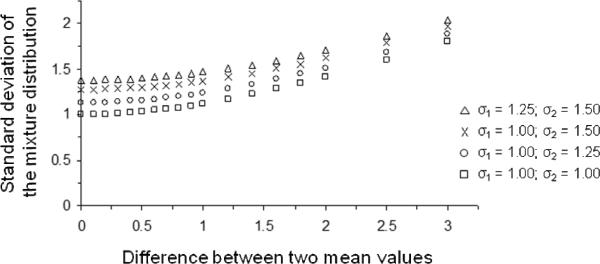
Figure 3.
Standard deviation of the mixture distribution as a function of mean difference between two Gaussian distributions. Four situations are illustrated: an equal-variance case (each standard deviation of the weak and strong memory distributions is 1.0) and three unequal-variance cases (the difference in standard deviation is 0.25 or 0.50, which is often seen in empirical data). As shown in the figure, the effect of mixing targets on the standard deviation of the mixture distribution is negligible until the difference between the two means is large (at least 1.20).

