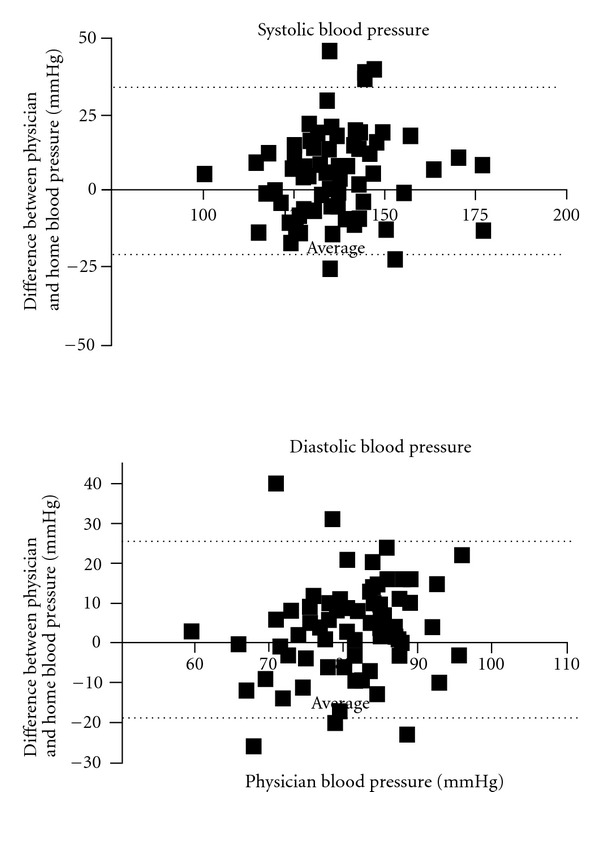
Figure 1.

Bland-Altman figures of the physician and home blood pressure. Bland-Altman plots—the difference between the physician and home blood pressure—are plotted against the physician blood pressure; therefore, a positive difference suggests an overestimation by physician, whereas a negative difference suggests an underestimation. The solid lines represent the mean difference between physician and home blood pressure; the dashed lines represent the 95% lines of agreement. For systolic blood pressure, the values are bias: 5.86; SD of bias: 14.25; 95% limits of agreement (−22.08, 33.79). For diastolic blood pressure, the value is bias: 3.59; SD of bias: 11.80; 95% limits of agreement (−19.54, 26.72).
