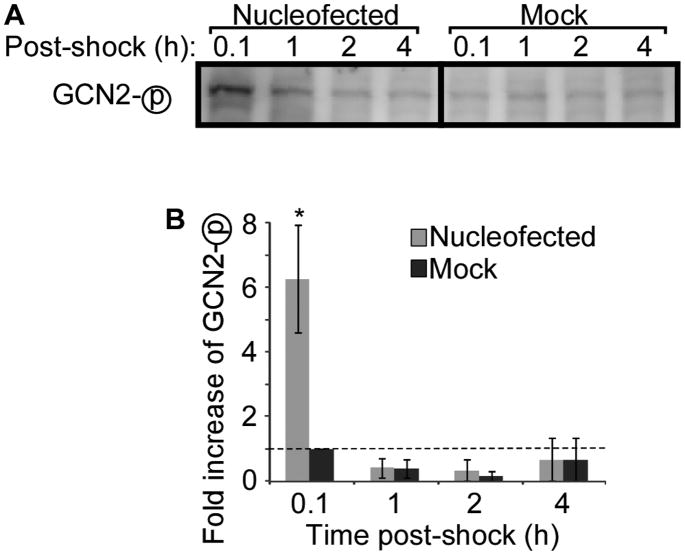
Figure 4. Nucleofection induces GCN2 phosphorylation in WT cells.
WT MEF cells were nucleofected or mock-treated and then lysed at the indicated time points. (A) Phosphorylation of GCN2 was assessed by western blotting. Representative data of three independent experiments is shown. (B) Quantitation of western blot band densities. Values were normalized to the values obtained in mock-treated cells at 0.1 hours post-shock. Data displayed is mean ± SEM of n = 3 experiments. Asterisk indicates P-value <0.05 compared to mock treatment.

