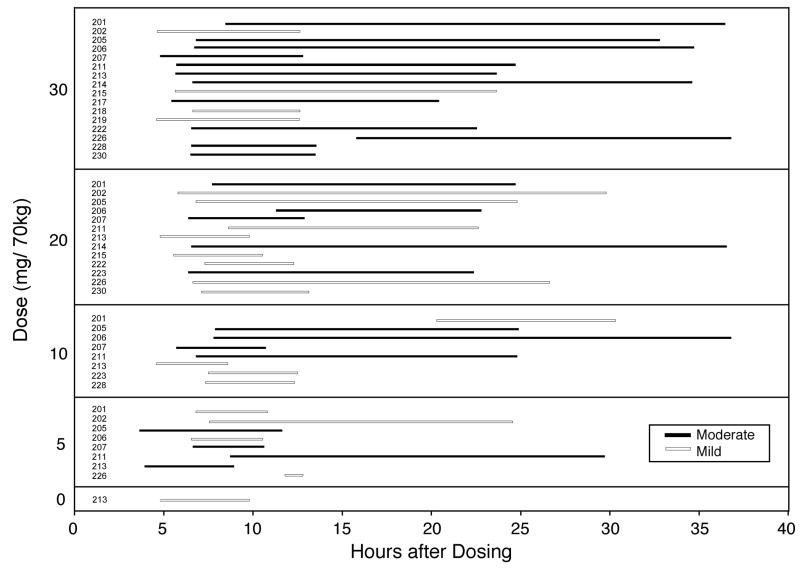
Fig. 3.
Individual participant data showing the incidence, timing (including onset time and duration), and severity of headaches for each dose condition. The y-axis shows the different dose conditions categorically. Each bar horizontal bar shows data for the participant number listed to right of the y-axis. Data are not shown for sessions without reported headache and sessions with missing data.

