Fig. 4.
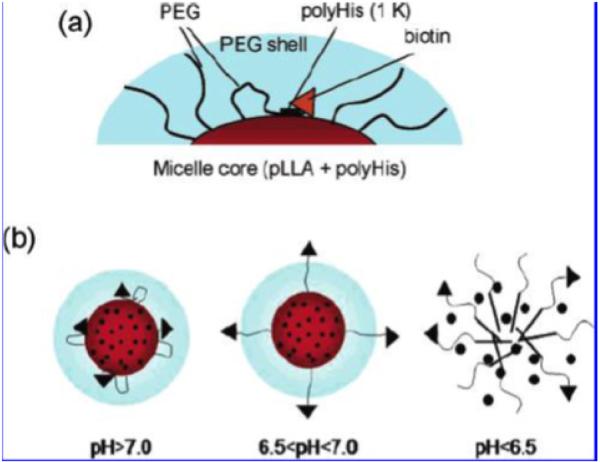
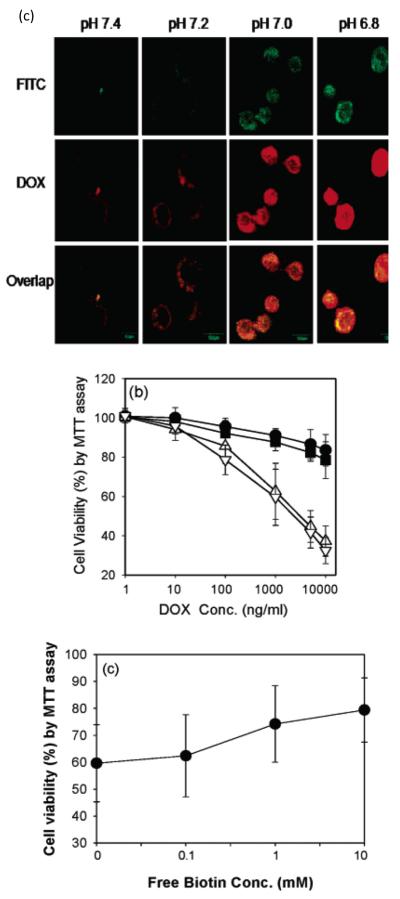
Illustration of polyhistidine micelles (a) Schematic illustration of micelles in physiological pH, where targeting ligands (biotin molecules) are hidden, because of the hydrophobicity of the polyHis (1k) chain that drags the targeting ligands close to the core and prevents them from exposing to the surface. (b) Schemic illustration of micelles approaching tumor pHe (6.5<pH<7), where targeting ligands begin to expose, due to the increase of hydrophilicity of polyHis (1k) chain that pushes the chain and the ligands out. Dimicellization occurs at even lower pH (pH<6.5). (c) In vitro results, where the upper one is ther confocal images of treated MCF-7 cells. DOX is loaded in FITC labeled micelles and the treatments are done at different pH values. The highest internalization of both the micelles and DOX molecules are observed at the lowest experimental pH (pH = 6.8). The middle figure is the cytotoxicity result at different pH values, i.e. pH 7.4 (●), 7.2 (■), 7.0 (△), and 6.8 (▽). Again, higher cytotoxicity is obtained at lower pH values. The lower one shows the competitive interactions of free biotin on the cytotoxicity of the test micelles (DOX content 1000 μg/mL). The cell viability increases as the concentration of free biotin increases. (Figs. 2 and 4 from [96]. Reprinted with permission from [96] E.S. Lee, K. Na and Y.H. Bae, Nano Lett., 5 (2005) 325. Copyright 2011 American Chemical Society.)


