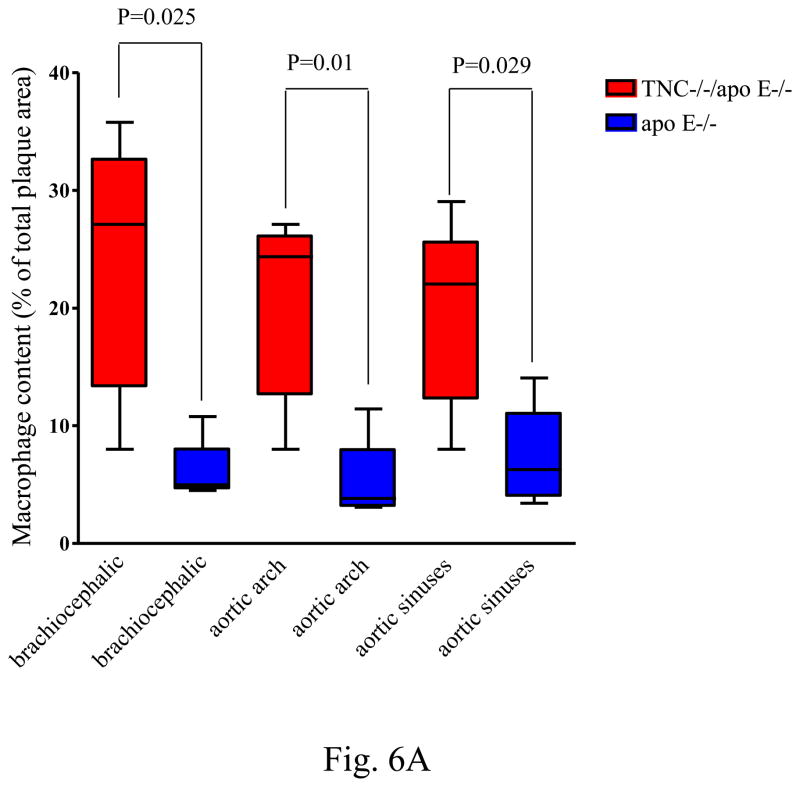
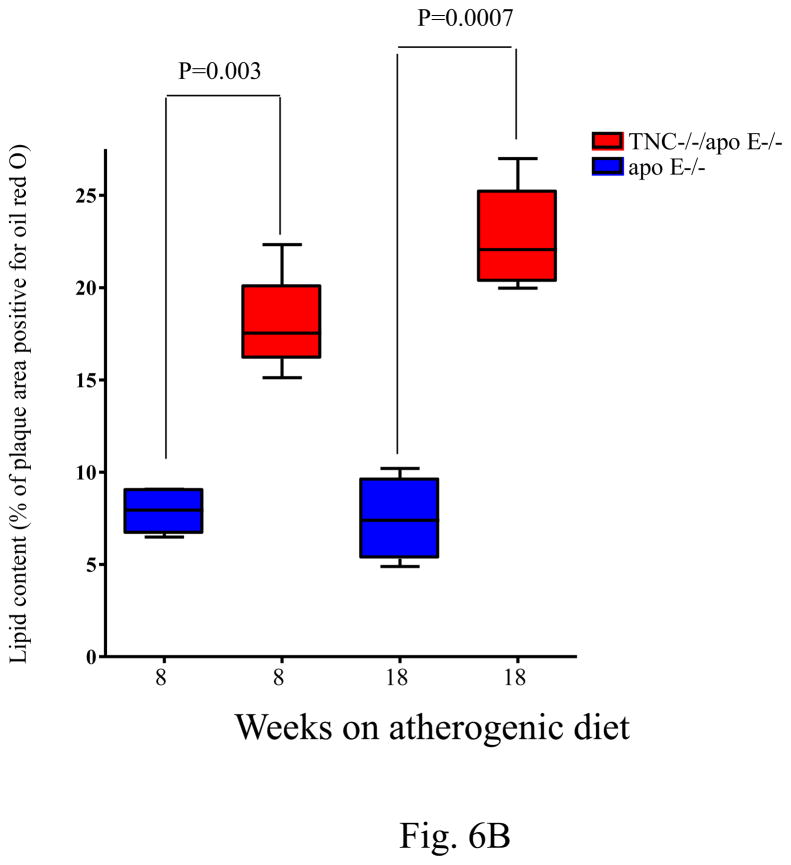
Fig. 6. Quantitative analysis of macrophage and lipid contents of the lesions.
Panel A shows the level of macrophage accumulation in different anatomic sites between the two mouse genotypes on atherogenic diet for 8 weeks. Panel B shows the extracellular accumulation of lipid as determined by Oil red O staining of aortic sinuses of TNC−/−/apo E−/− mice and apo E−/− mice on atherogenic diet for indicated times.


