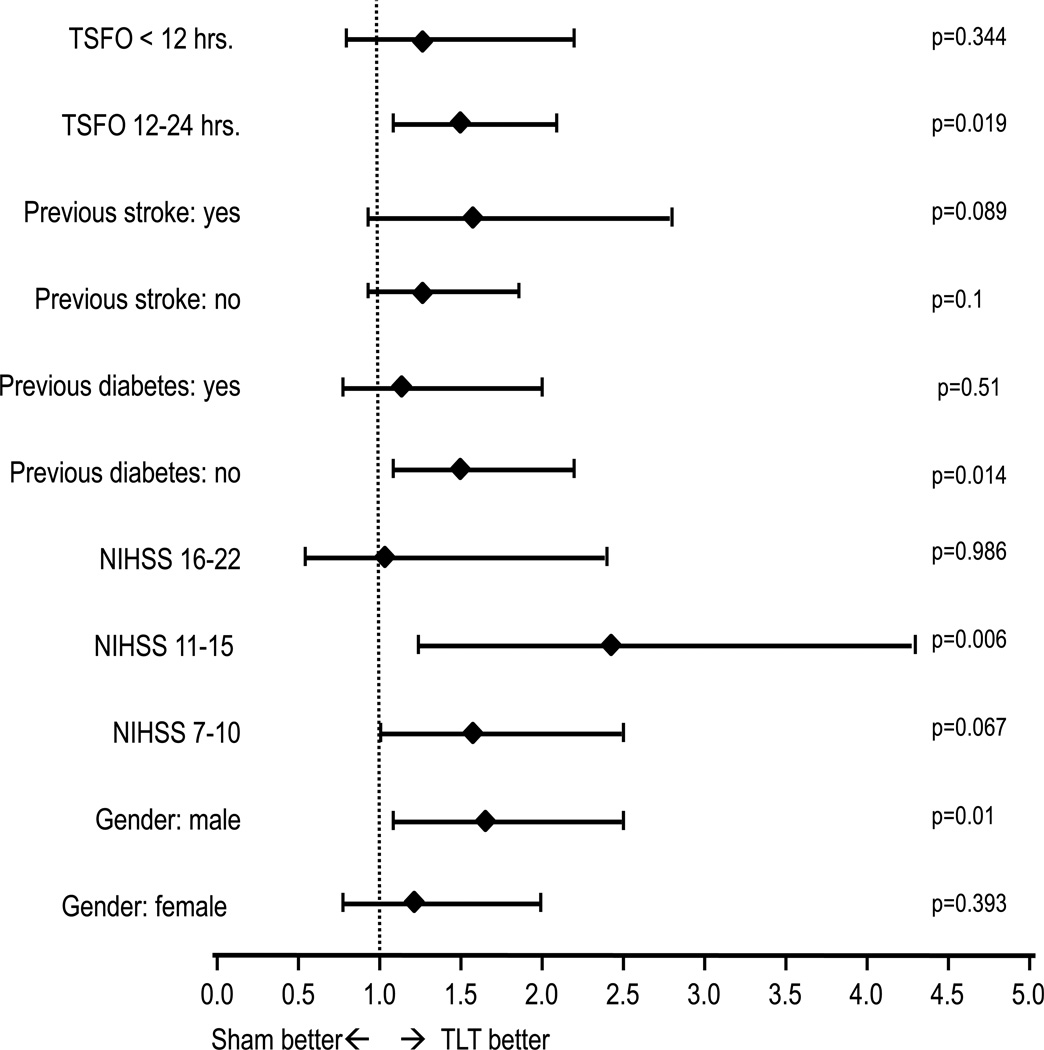
Figure 3.
Forest plot with unadjusted odds ratios for TLT as compared to sham for the 90 day mRS score of 0 to 2 on subsets of the data defined by categories selected from the baseline characteristics (Time from stroke onset (TFSO) to treatment, history of previous stroke, initial NIHSS and gender). The horizontal lines indicate 95% CIs. P values for each stratum on the right.

