
Figure 1.
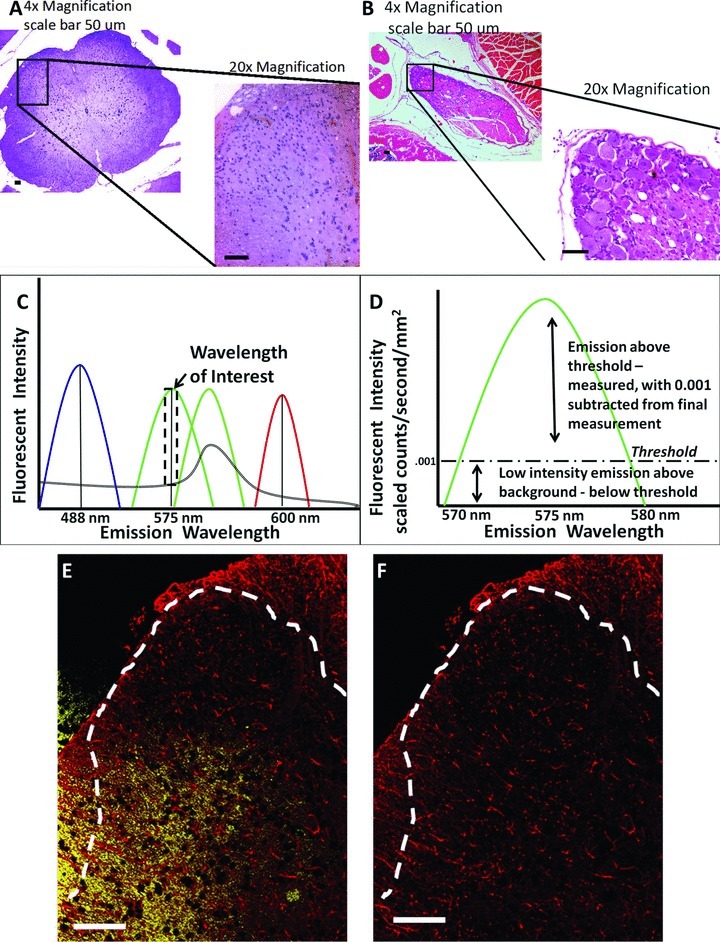
Anatomical location of images acquired and spectral analysis allows for discrete fluorescence signal detection and analysis. (A) Hematoxylin and eosin staining of the dorsal horn of the spinal cord and (B) dorsal root ganglion (area within black box) is displayed in context to relevant anatomical structures (the entire spinal cord and partial cauda equina, respectively) at 4× magnification, and then at 20× magnification. (C) Representative fluorescent emission for DAPI (blue) FITC (light green), GFP (dark green) Rhodamine Red (red), and autofluorescence (double black). Selection of narrow fluorescent peak emission bands (dotted black box around FITC wavelength) allows for analysis of only FITC signal, without autoflourescent or GFP signal contaminating fluorescent analysis. (D) Representative fluorescent emission threshold level of FITC defined and expanded from dotted black box in (C) with the fluorescent threshold of intensity set (dashed black line), above autofluorescent levels. (E) Representative spectral image of dorsal horn spinal cord as stained for GFAP (red), with autofluorescent signal defined in yellow. (F) Same image in (E) with autofluorescent signal removed. In all images the scale bar is equal to 50 μm.