
Figure 3.
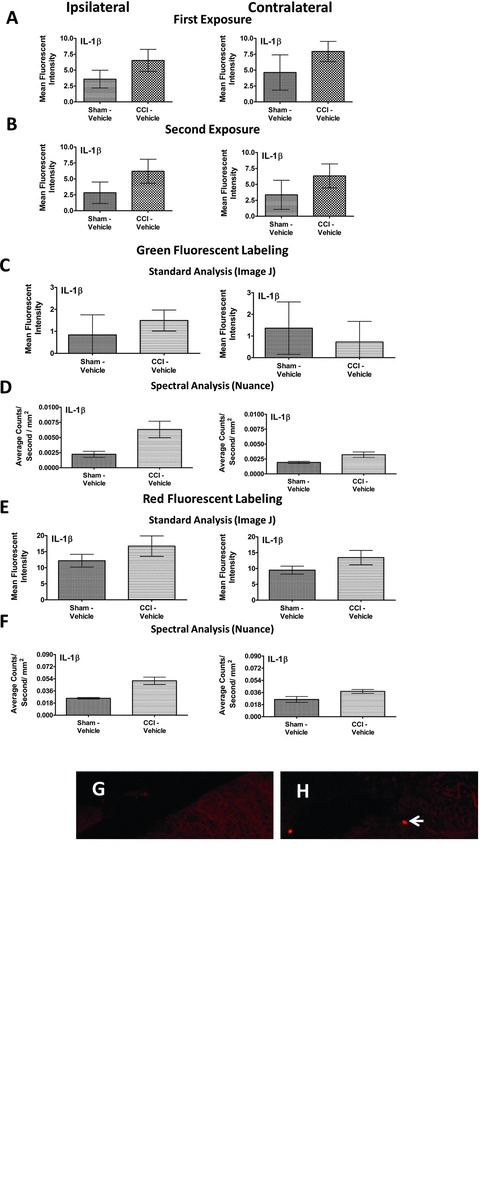
Spectral versus standard Image J immunofluorescent intensity quantification comparison. (A) Utilizing Image J software for immunofluorescent quantification, no significant IL-1β IR differences between CCI-induced neuropathy or nonneuropathic sham-treated rats in either the ipsilateral or contralateral dorsal horn of the spinal cord. IL-1β IR was observed by FITC-labeled secondary antibody. (B) Following a second exposure for image capture, fluorophore fading was virtually absent thereby lacking potential artificial IR intensity differences between experimental conditions. (C) A comparison of sham- and CCI-treated rats with i.t. vehicle using Image J immunofluorescent quantification resulted in no significant fluorescent intensity differences of labeled IL-1β IR between groups, in either the ipsilateral or contralateral dorsal horn. (D) Utilizing spectral immunofluorescent quantification, significant differences of fluorescent intensity from FITC-labeled IL-1β between sham- and CCI-treated rats given i.t. vehicle was observed in the ipsilateral, but not contralateral dorsal horn spinal cord. (E) An examination of fluorescent intensity between groups with a flourophore of a different spectral signature, Rhodamine Red (600 nm), using standard Image J immunofluorescent quantification revealed no significant group differences between sham- and CCI-treated rats despite a trend of increased IL-1β IR in CCI-treated rats with i.t. vehicle in either the ipsilateral or contralateral dorsal horn. (F) Spectral immunofluorescent quantification of Rhodamine Red labeled IL-1β yielded significant group differences between nonneuropathic sham rats and CCI-treated rats with vehicle in the ipsilateral dorsal spinal cord. IL-1β IR increases were absent in the contralateral dorsal horn. (G, H) Representative fluorescent images analyzed with Image J at 20× magnification of IL-1β fluorescent labeling (red). (I, J) Representative spectrally unmixed images at 20× magnification of IL-1β fluorescent labeling (red) with DAPI nuclear stain (blue). In all images, the scale bar is equal to 50 μm. All sections were 7-μm thick, and collected 1.5 h after i.t. vehicle administration 10 days after CCI or sham surgery.