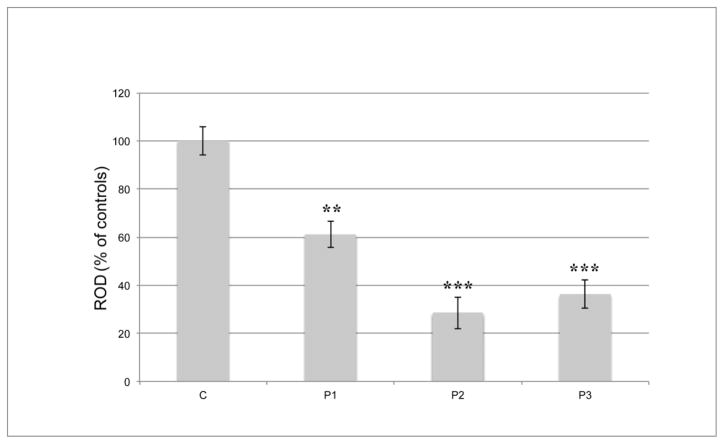
Fig. 2. CalbindinD 28KD (CB) protein expression by Western blot.
Each bar indicates the percentage value of CB protein expression by western blot, compared to the mean value of two control samples (100%). All available samples from P1, P2, and P3 show significant reduction in regional. CB at the protein level. Error bars represent the standard deviation. ROD= relative optical density; **, P < 0.01; *** P < 0.001.

