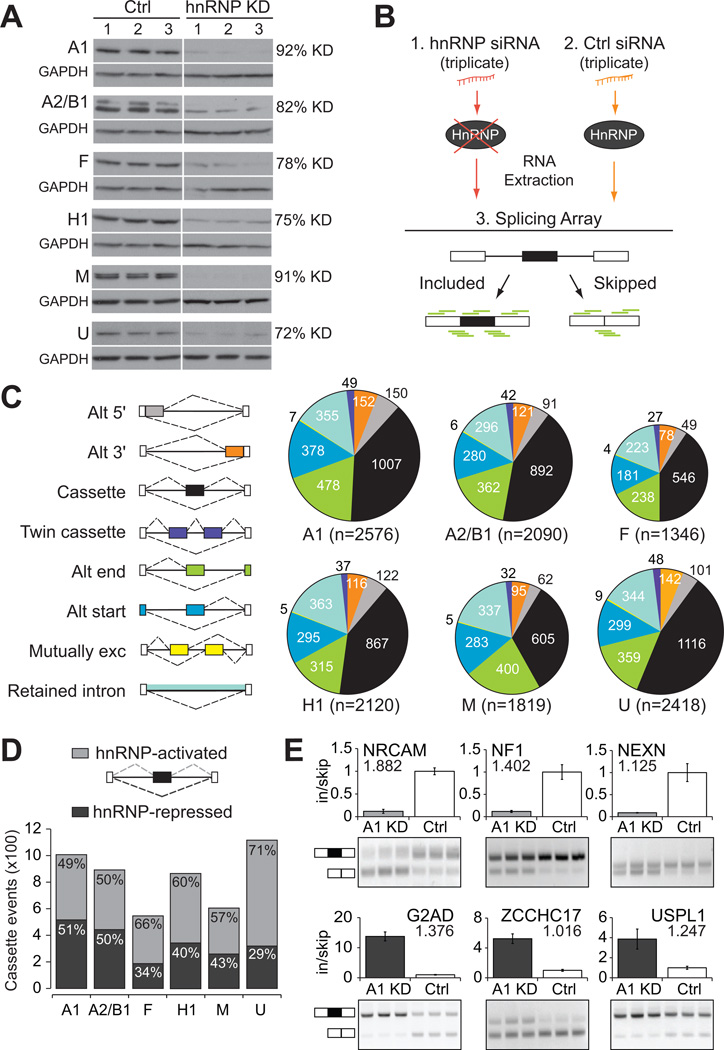
Figure 1. Thousands of hnRNP-dependent alternative splicing events identified in human cells.
(A) Western analysis demonstrating successful depletion of hnRNP proteins A1, A2/B1, F, H1, M, and U in human 293T cells in triplicate experiments. GAPDH was used as a loading control. The extent of protein depletion was quantified by densitometric analysis. (B) Experimental strategy for identification of alternative splicing (AS) events. Total RNA was extracted from human 293T cells treated with (1) hnRNP-targeting siRNA(s), or (2) a control non-targeting siRNA, and (3) was subjected to splicing-sensitive microarrays (probes depicted in green). (C) Pie charts of differentially regulated AS events as detected by splicing arrays. Colors represent the types of AS events that were detected and the size of each pie chart reflects the number of events detected. (D) Cassette exons differentially regulated upon depletion of individual hnRNP proteins, relative to control. Bars are divided to display the proportion of events that are less included upon depletion (hnRNP-activated, light gray), or more included upon depletion (hnRNP-repressed, dark gray). (E) RT-PCR validation of hnRNP A1-regulated cassette exons (P < 0.01, t-test). Light gray indicates activation of exon inclusion and dark gray indicated repression of exon inclusion. Absolute separation score predicted by the splicing array analysis is listed below the affected gene name. Bar plots represent densitometric analysis of bands and error bars are standard deviations within triplicate experiments (See also Figure S1).

