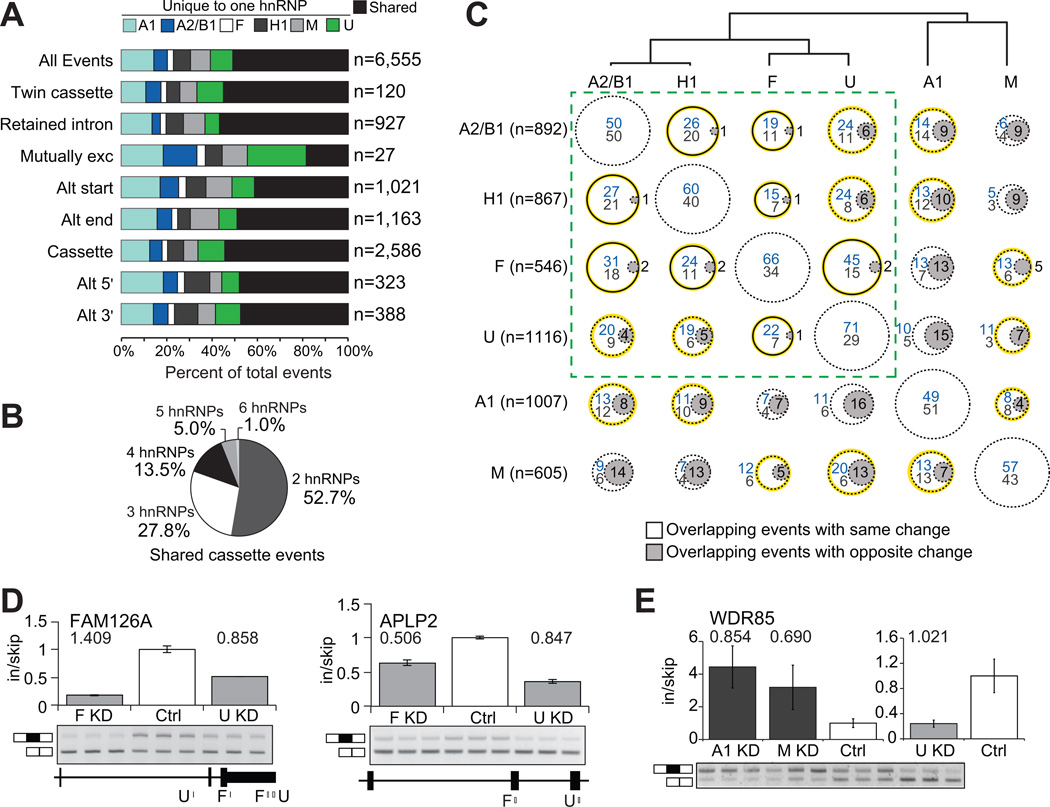
Figure 2. Multiple hnRNP proteins co-regulate AS events.
(A) For each type of AS event, the percentage of events that was affected in more than one hnRNP depletion is in black, and the percentage of events that was affected uniquely in a single hnRNP depletion. (B) Distribution of shared cassette exons affected by 2 to 6 hnRNP proteins. (C) Comparisons of the overlap and directionality of cassette exons affected by pairs of hnRNP proteins. The dendrogram displays the hierarchical clustering of all cassette exons regulated by each hnRNP protein. Circles represent the percent of overlapping events for the hnRNP in the row, with the hnRNP listed in the column. Circles with gray shading indicate overlapping events that were affected in opposing directions (depletion of one hnRNP protein leads to inclusion and depletion of the other hnRNP leads to skipping). For cassette exons that were affected in the same direction, blue values indicates the percentage of events that were hnRNP-activated while values in gray listed below represent percentage that were hnRNP-repressed. The solid black lines represent significant overlap of targets (P < 0.05, hypergeometric test) and the yellow highlighting denotes overlapping cassettes that are significantly changing in the same direction (P < 0.002, hypergeometric test). The dashed-line box contains the hnRNP proteins that are most similar. (D) RT-PCR validations of cassette exons affected in the same direction upon depletion of hnRNP F or hnRNP U (P < 0.01, t-test). Binding of hnRNP F and U near the cassette exon is shown below. (E) RT-PCR validation of a cassette exon similarly affected by depletion of hnRNPA1 or hnRNP M, but opposite from the change caused by depletion of hnRNP U (P < 0.05, t-test). Absolute separation score as predicted by the splicing array analysis is listed above the bars. Bar plots represent densitometric analysis of bands and error bars are standard deviations in triplicate experiments (See also Figure S2).

