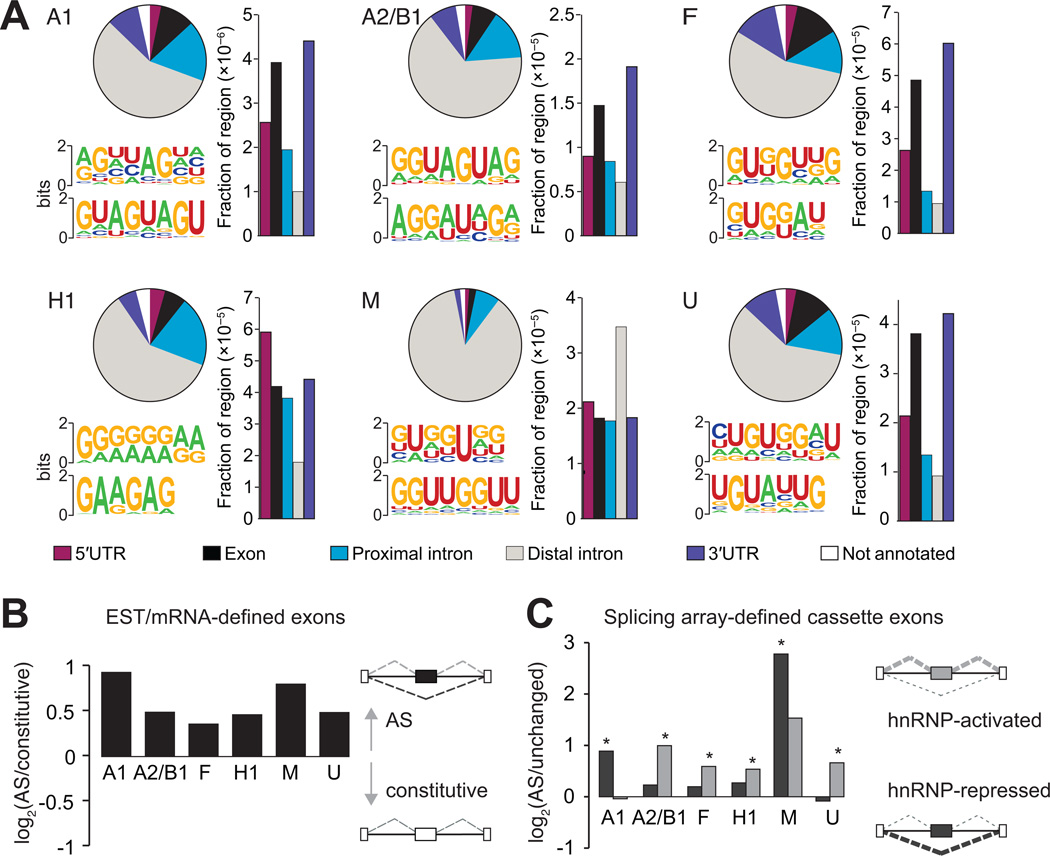
Figure 3. HnRNP proteins bind to sequence motifs in vivo and are enriched near regulated exons.
(A) Distribution of hnRNP binding sites within different categories of genic regions (pie charts). Bar plots represent the fraction of a particular region bound, relative to the total genomic size of the region. The most representative top motifs identified by the HOMER algorithm are also shown. (B) Preference for hnRNP protein binding near expressed sequence tag (EST) or mRNA-defined cassette exons. The y-axis is the log2 ratio of the fraction of 41,754 cassette exons to the fraction of 222,125 constitutive exons harboring hnRNP binding clusters within 2 kilobases (kb) of the exon. All bars are significant (P < 10−28, Fisher exact test). (C) Preference for hnRNP proteins to bind proximal to splicing array-defined cassette exons that are activated or repressed by a specific hnRNP protein. The y-axis is the log2 ratio of the fraction of changed cassette exons to the fraction of unchanged cassette exons having hnRNP binding clusters within 2 kb of the exon. Dark gray bars represent the preference for hnRNP-repressed compared to unaffected exons and light gray bars represent the preference for hnRNP-activated compared to unaffected exons. A single asterisk denotes the most significant binding preference (P < 0.05, Fisher exact test). (See also Figure S3).

