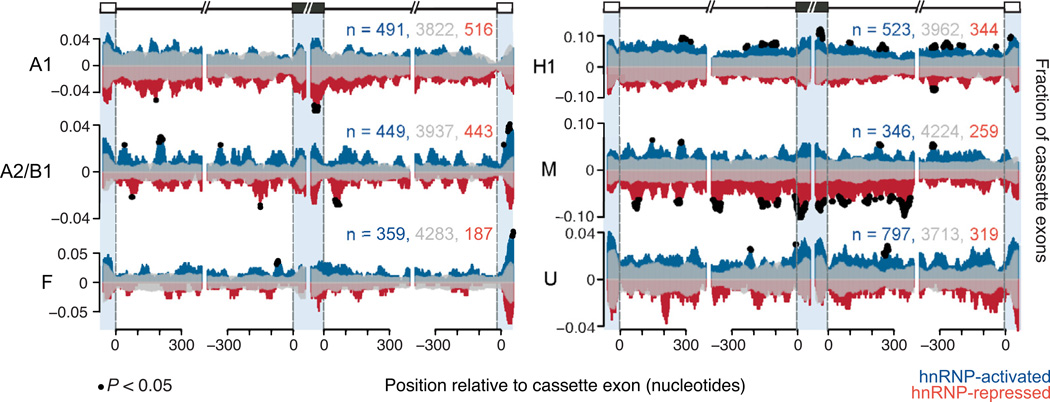
Figure 4. HnRNP proteins bind in a position-specific manner around cassette exons.
RNA splicing maps showing the fraction of microarray-detected cassette exons with CLIP-seq reads located proximal to activated (positive y-axis, blue), repressed (negative y-axis, red), and unaffected cassette exons (reflected on positive and negative y-axis, transparent gray). The x-axis represents nucleotide position relative to upstream, cassette and downstream exons. Blue shading separates positions that fall in the upstream exon (left, −50-0), in the cassette exon (middle left, 0–50, middle right, −50-0) and in the downstream exon (right, 0–50). Black dots represent nucleotide positions where significantly more hnRNP-activated cassette exons or hnRNP-repressed cassette exons showed binding, compared to unchanged cassette exons (P < 0.05, chi-square test). The total counts for activated, unaffected, and repressed exons that were used to generate the maps are listed. (See also Figure S4).

