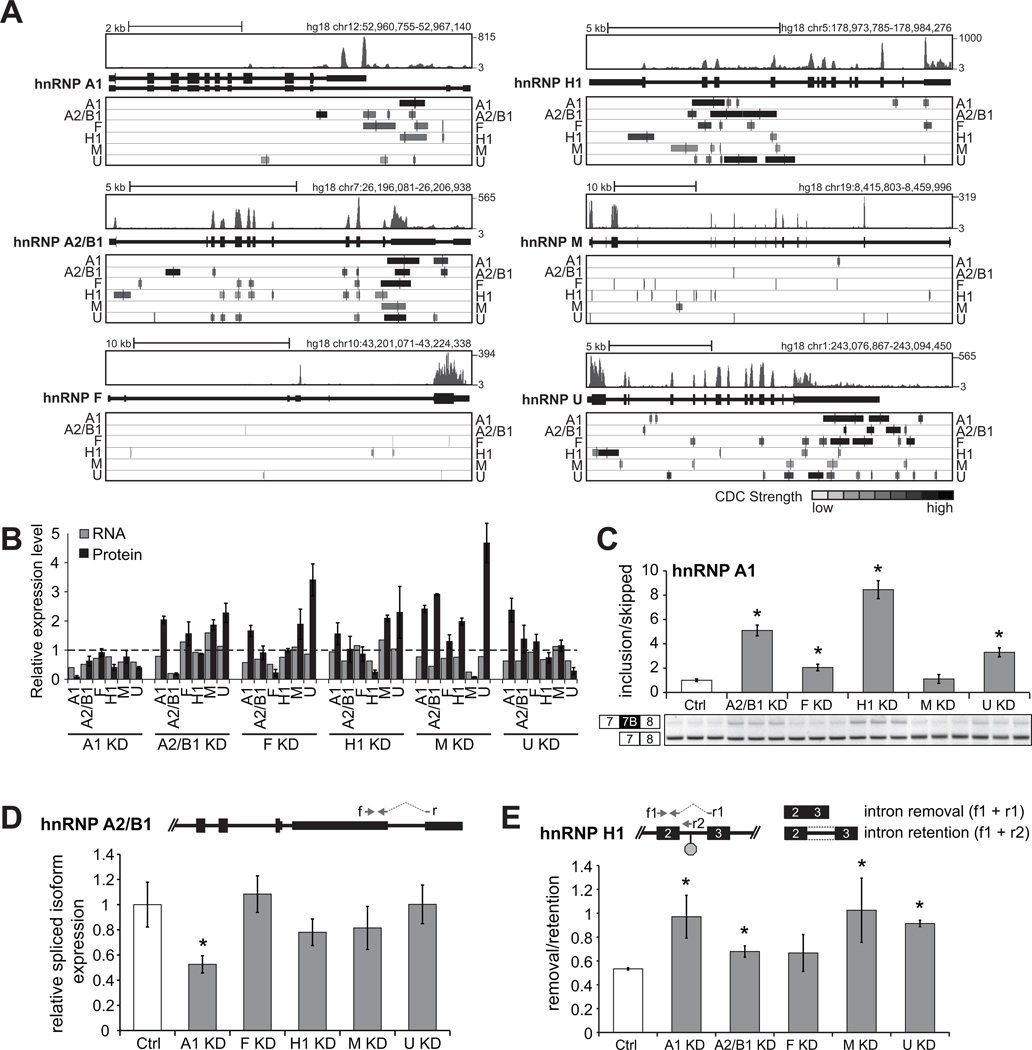
Figure 5. Cross-regulation of hnRNP proteins adds complexity to splicing regulation.
(A) CLIP-derived clusters (CDCs) identified for each hnRNP within each of the 6 hnRNP gene structures. CDCs are shaded according to strength of binding, where darker shading indicates more significant read coverage. RNA-seq read distributions in control siRNA treated 293T cells are shown above each hnRNP gene structure. (B) Quantification of hnRNP protein abundance (based on densitometric measurements of Figure S5 bands) and RNA abundance (based on RNA-seq RPKMs) within the context of the different hnRNP depletion conditions. Y-values are fold-changes over the control protein and RNA levels. (C) RT-PCR splicing validation of hnRNP A1 exon 7B in each of the hnRNP KD experiments. Bars represent densitometric measurements of bands relative to control. Significant changes relative to control are starred (P < 0.002, t-test). (D) Relative expression of an hnRNP A2/B1 spliced 3’UTR NMD candidate isoform in each of the hnRNP KD experiments. Primers ‘f’ and ‘r’ are depicted. Bars represent an average abundance by qRT-PCR across triplicate KD experiments, relative to control. All measurements were normalized to GAPDH expression. Significant changes relative to control are starred (P < 0.001, t-test). (E) Ratio of relative hnRNP H1 isoform expression with intron removed (measured with primers f1 and r1 depicted) compared to relative hnRNP H1 isoform expression with intron retained (measured with primers f1 and r2 depicted) in each of the hnRNP KD conditions. Bars represent an average abundance by qRT-PCR across triplicate KD experiments relative to control. All measurements are normalized to GAPDH expression. Asterisks denote significant changes relative to control (P < 0.04, t-test).

