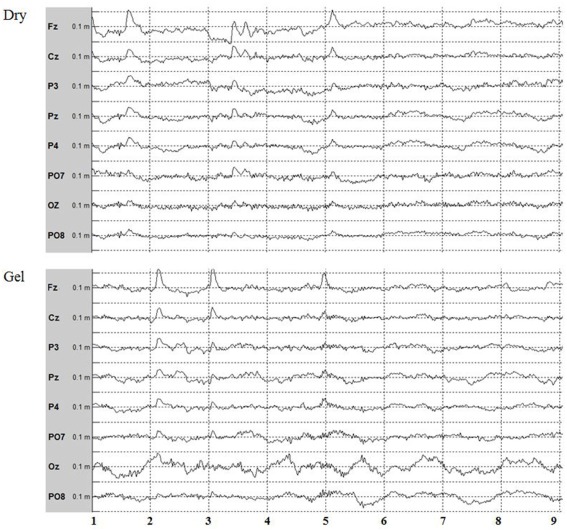
Figure 3.
Eight-channel EEG data from the P300 experiment acquired with dry and gel electrodes for one subject over frontal, central, parietal, and occipital sites. The EOG artifacts are mostly visible on Fz, Cz, P3, Pz, and P4 and look fairly similar for gel and dry electrodes. The y-axis is scaled with ±100 μV, and the x-axis presents seconds. The data are bandpass filtered between 0.1 and 30 Hz with a 50 Hz notch filter.

