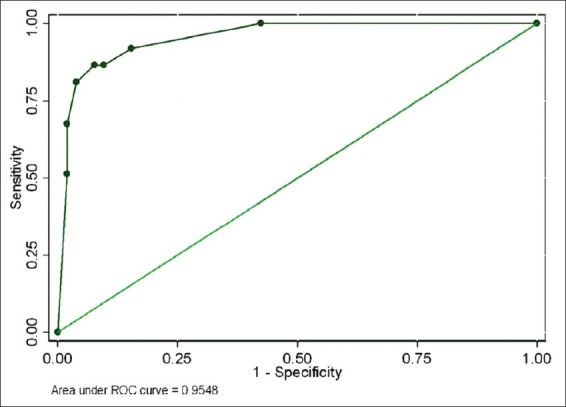
Figure 2.

Receiver–operating characteristic (ROC) curve for caregiver factors responsible for major stress. The model based on three risk factors – inconvenience, demands on time, financial stress – at 1 month does quite well for predicting caregiver stress at 1 month. The area under the ROC curve is 95%, sensitivity is 86% and specificity is 92%. The odds ratio and regression coefficient are highest for inconvenience (OR 23.42), intermediate for demands on time (OR 13.54) and lowest for financial stress (OR 5.12) – all being statistically significant
