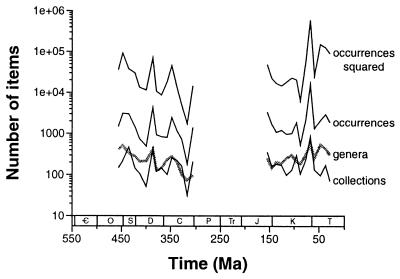
Figure 2.
Current marine paleofaunal contents of the Paleobiology Database. The curves show only the amount of raw data available for analysis and have no necessary biological meaning. Log scale is used because the variables are highly skewed on a linear scale. Period names are given in the legend for Fig. 1. Top black line, sum of squared counts of occurrences in each collection in each 10-Myr-long bin. Middle black line, number of taxonomic occurrences summed across collections in each bin. Bottom black line: number of fossil collections per bin in the two major study intervals. Thick gray line, number of distinct genera sampled in each bin. High diversity peaks in the late Ordovician and Maastrichtian correspond to relatively well-sampled temporal intervals; smaller-scale variation in this diversity curve also tracks variation in sampling intensity.

