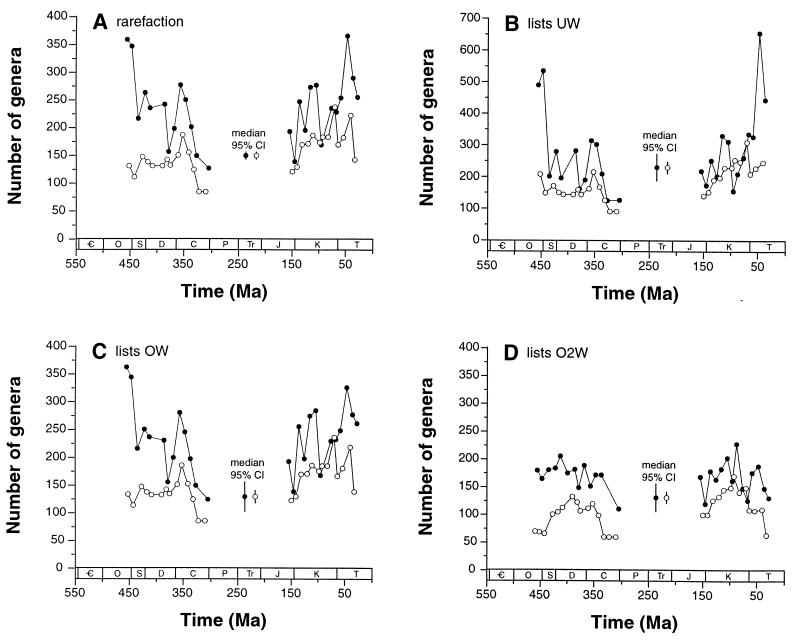
Figure 3.
Diversity curves corrected for variation in sampling intensity by using four different subsampling algorithms (Table 2) and two methods of counting genera. Each data point represents the median value seen across 100 individual subsampling trials. Some data points are excluded when bins fail to meet the appropriate sampling quota. Filled circles show counts of genera actually sampled within a bin; open circles show counts of genera crossing the boundaries between consecutive bins. Legends labeled “95% CI” show the median 95% confidence interval across all intervals in a particular analysis; separate values for sampled-within-bin and boundary-crosser counts are illustrated. Only North American, European, North African, and Middle Eastern collections, and only occurrences of Anthozoa, Brachiopoda, Echinodermata, Mollusca, and Trilobita, are included in the analyses. Period names are given in the legend for Fig. 1. (A) Classical rarefaction of taxonomic occurrences. Individual taxonomic occurrences are randomly and independently drawn until each temporal bin includes 700 occurrences. (B) Subsampling by unweighted lists (UW). The algorithm draws 90 lists per bin. (C) Subsampling of lists weighted by taxonomic occurrences (OW). The number of taxonomic occurrences included in each list is summed, and lists are drawn until each bin includes lists totaling 700 occurrences. (D) Subsampling of lists weighted by taxonomic occurrences squared (O2W). This method counts the sum of the squared richness values for the lists that are drawn. Each bin includes 10,000 occurrences-squared.

