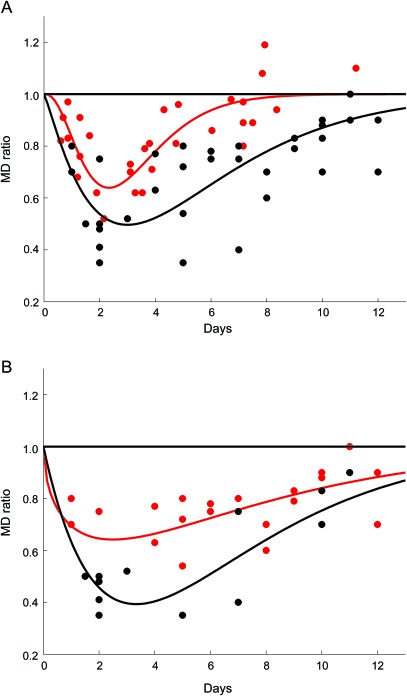
Figure 2. Time course of the changes in the MD ratio over the 2 weeks following injury.
In (A) the red circles are reproduced from figure 1 in reference 17 and represent the mean diffusivity (MD) ratio in normothermic patients. The black circles represent the MD ratio in patients treated by hypothermia. Superposed on the figure are γ-variate functions that approximate the time course of the data. The red line represents the time course for the normothermic cohort, and the black line approximates the time course for the hypothermic group. Notice the delay in time to pseudonormalization in the hypothermia cohort as compared to the normothermia group. In (B) only the hypothermic cohort is presented and is divided into 2 groups. The red circles represent the mild/moderate injured group, and the black circles represent the severely injured group. The red line is the γ-variate approximation for the mild/moderate injured group, and the black line represents the time course for the severely injured cohort. Notice that the MD ratio is lower on average in the severely injured group but there is no difference in the time of pseudonormalization in the 2 groups.

