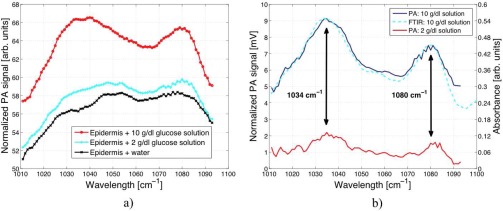
Fig. 8.
a) PA spectrum of a human epidermal skin sample in contact with water x, 2 g/dl (
 ) and 10 g/dl glucose solution (
 ). b) PA spectrum of different glucose concentrations (2 and 10 g/dl) in human epidermal skin samples with subtracted water and skin background. A comparison of a FTIR attenuated total reflection spectrum of glucose shows a good correlation with the PA measurement.

