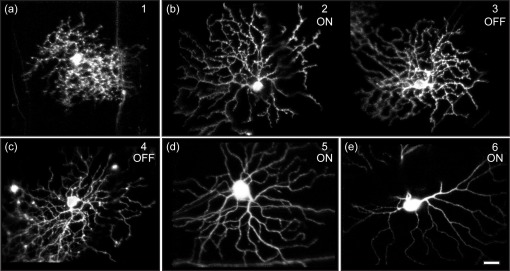
Fig. 14.
In vivo imaging of six more monostratified ganglion cells. Shadows from large blood vessels can be seen in images of cell 2, 4 and 6. Cells 5 and 6 are taken from transgenic mice with ganglion cells expressing YFP, and all other cells are labeled with retrograde viral vector. Images are contrast stretched for display purposes. Scale bar: 20 μm.

