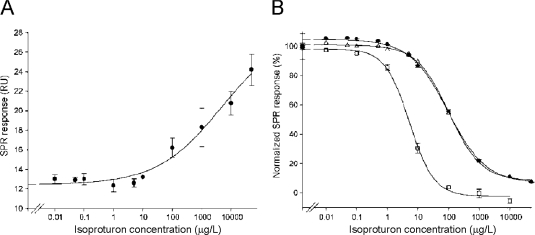
Figure 4.
(A) The calibration curve of isoproturon generated in the direct detection SPR assay. (B) The calibration curves of isoproturon in the competitive assay for three different densities of the ligand on the surface of the chip. Adapted from Gouzy et al. [32].

