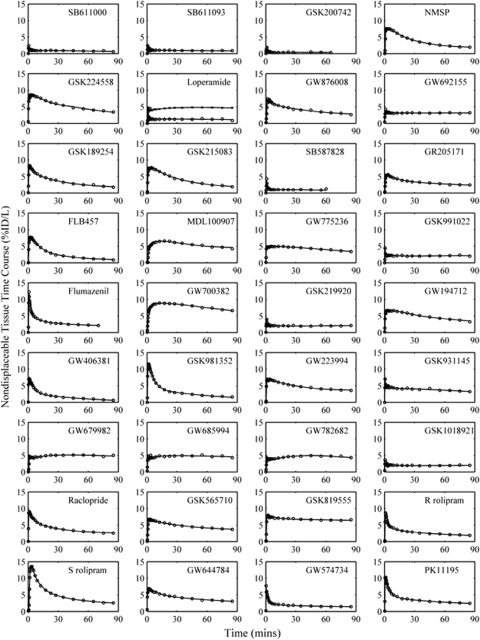
Figure 3.
Positron emission tomography (PET) cerebellar time activity curves (TACs) for the (n=36) radiolabelled compounds (○) and model fits from the parsimonious compartmental analysis (−). For [11C]Loperamide two scans are shown, one at baseline (○) and the other after administration of 30 mg cyclosporin-A ( × ) which inhibits P-glycoprotein (P-gp).

