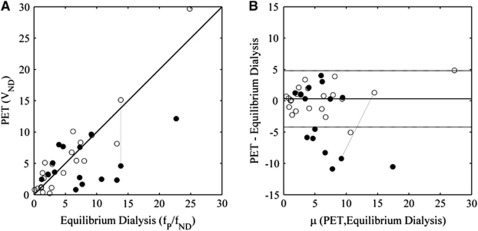
Figure 4.
Comparison of in-vitro (equilibrium dialysis free fraction ratio—fP/fND) and in-vivo (positron emission tomography (PET) nondisplaceable distribution volume—VND) measures. The symbols used indicate whether the in-silico modelling predicted that they were more likely to be P-glycoprotein (P-gp) substrates (•) or whether they were more likely to undergo passive diffusion (○). (A) Plot of equilibrium dialysis versus PET. (B) Bland-Altman plot of data in panel A using data from the compounds predicted in-silico to undergo passive diffusion (○) to define the confidence intervals (μ denotes the mean). In both plots, the data connected by the dashed line identify the results from the two [11C]Loperamide scans (baseline (•) and the other after administration of 30 mg cyclosporin-A (○) which inhibits P-gp).

