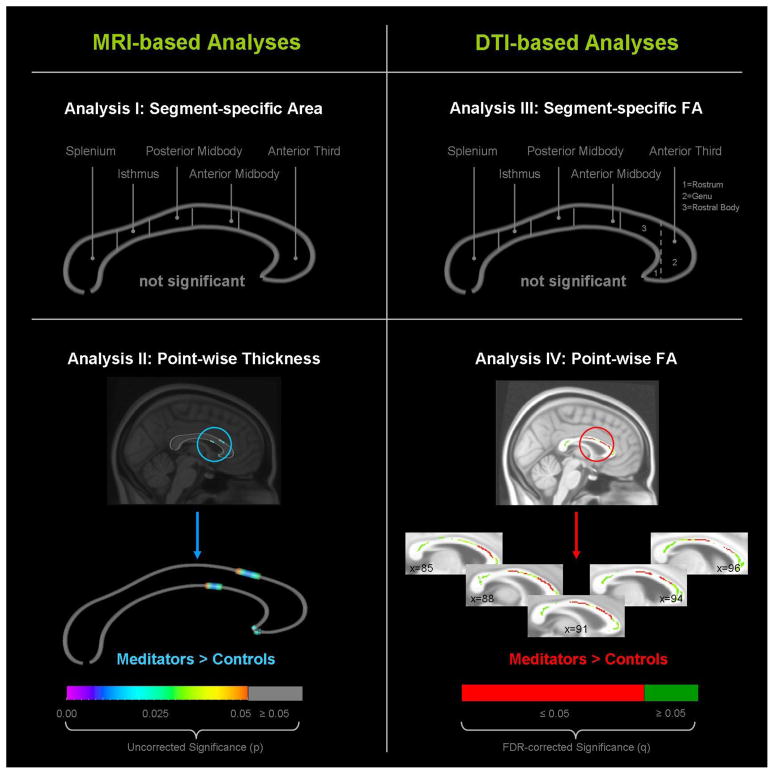
Figure 1. Group differences in callosal attributes.
MRI-based measurements are shown on the left; DTI-based measurements are shown on the right. Global measurements (segment-specific callosal area and FA) are shown in the top panels; local measurements (point-wise callosal thickness and FA) are shown in the bottom panel. The color bars in the bottom panels encode significance. MRI-based findings are provided uncorrected (on the midsagittal section) and DTI-based findings are provided FDR-corrected (on the midsagittal section and two additional slices to the right and to the left).

