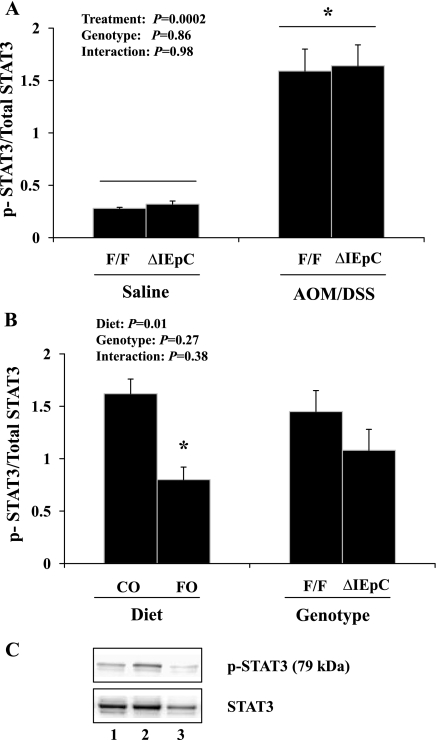
Fig. 5.
Ratio of phosphorylated to total STAT3 expression in murine colonic mucosa as assessed by immunoblotting. Within each genotype (PPARδF/F and PPARδΔIEpC), mice were fed 5% corn oil (CO) diet and treated with AOM/DSS (n = 4) or received an equal volume of saline intraperitoneally without DSS (control) in drinking water (n = 2). Ratio of phosphorylated (i.e., activated) to total STAT3 protein expression (pSTAT3/STAT3) was assessed by 2-way ANOVA. Values are means ± SE. *P ≤ 0.05. A: effect of AOM/DSS treatment (P = 0.0002). B: effect of AOM/DSS in mice from each genotype fed CO (n = 4) or FO (n = 4) diet (P = 0.01). C: representative immunoblots from PPARδF/F mice (top) and phosphorylated and total STAT3 (bottom). Samples are from AOM/DSS-treated FO-fed PPARδF/F mice (lane 1), AOM/DSS-treated CO-fed PPARδF/F mice (lane 2), and saline-treated (no DSS treatment) CO-fed PPARδF/F mice (lane 3).

