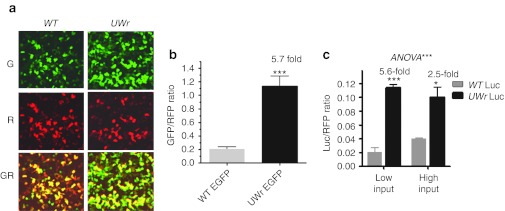
Figure 2.
Effect of sequence modification and normalization on DNA uptake and expression. (a) Representative image showing green (G), red (R; red fluorescent protein (RFP) plasmid normalization plasmid), and superimposed GR channels. (b) HEK293 cells were cotransfected with green fluorescent protein (GFP) (100 ng) and RFP (25 ng) expression plasmids. The fold ratio changes between the expression levels as a result of WT and UWr-coding region modification are shown (mean ± SEM) for three independent experiments. (c) HEK293 cells (3 × 10⁴ cells/well) in 96-well microplates were cotransfected with RFP expression plasmid and expression vectors containing either the WT-coding region or the UWr-coding region using low DNA input (10 ng/well) or high DNA input (75 ng/well).

