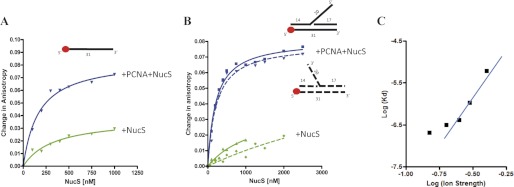
FIGURE 3.
Fluorescent anisotropy measurements of PabNucS binding to DNA. A, binding curves of PabNucS for a single-stranded oligonucleotide either in the presence (blue line) or absence of PabPCNA (green line). B, binding curves of PabNucS for both 3′ flap (dotted line) and 5′ flap (continuous line) substrates in the presence (blue line) or absence (green line) of PabPCNA. C, log-plot of the Kd of PabNucS-PCNA complex on the 5′ flap as a function of ionic strength (from 150 to 400 mm NaCl). The line corresponds to linear regression of data points from 200 to 400 mm NaCl.

