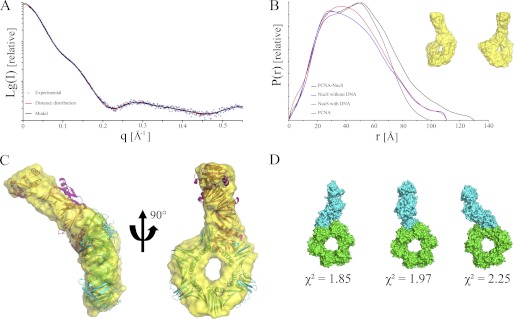
FIGURE 4.
Solution structure of the PabNucS-PCNA complex. A, scattering curve, and B, P(r) of the complex PabPCNA-NucS (black) in comparison to PabNucS, in the absence (blue) and presence (red) of DNA and PabPCNA (purple). The average ab initio shape predicted is shown in the inset. C, the average SAXS envelope is superimposed on the atomic models of PabNucS and PabPCNA. D, SAXS-directed docking of PabNucS (blue) onto PabPCNA (green). Only models satisfying the experimental SAXS data were kept, low χ2 values indicates very good agreement of the models to the experimental data.

