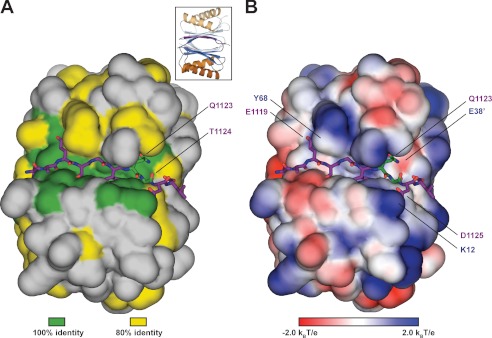
FIGURE 4.
Dyn2 binds substrates through a highly conserved, positively charged composite groove formed by Dyn2 dimerization. A, conservation, as highlighted in Fig. 1A (green, 100% identity; yellow, 80% identity, as determined across 12 diverse species), mapped on the Dyn2 dimer shown in surface representation. Nup159 pep2 is shown in stick format in purple, inserted in the highly conserved interdimer groove. The highly conserved QT substrate motif (green sticks) is located C-terminal to the Nup159_2 β-strand. Conservation, however, is equally distributed across the Dyn2 substrate binding region. The inset shows the relative orientation of the complex in graphic format colored as in Fig. 2A. B, electrostatic surface calculated using APBS to generate solvent-accessible surface potentials that are shown in kBT/e, colored according to the key shown (42). Nup159 pep2 is shown in purple stick format with specific Dyn2 residues involved in hydrogen bond contacts labeled. The conserved QT motif is shown in green stick format. Dyn2-Nup159 pep2 interactions include Tyr-68–Glu-1119, Glu-38′–Gln-1123, and Lys-12–Asp-1125. The complex is oriented as in A.

