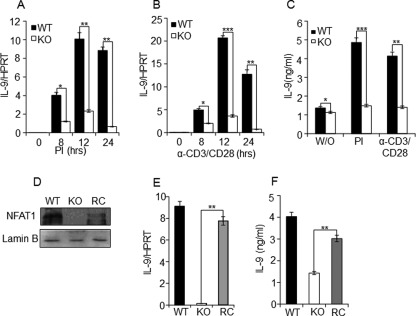
FIGURE 3.
NFAT1 reconstitution restores IL-9 expression in the NFAT1-deficient Th9 cells. Th9 cells differentiated from WT and NFAT1−/− (KO) were stimulated by PI (A) or α-CD3/CD28 (B) for the indicated time, and IL-9 expression was measured by qRT-PCR by normalizing with the level of housekeeping gene hypoxanthine-guanine phosphoribosyltransferase. C, the IL-9 protein levels in culture supernatant that was either unstimulated (W/O) or restimulated for 24 h by PI or α-CD3/CD28 were quantified by ELISA. The data shown are expressed as mean ± S.E. (error bars) (n = 3); *, p < 0.05; **, p < 0.01; ***, p < 0.001. D, relative level of NFAT1 was analyzed in WT, KO, or NFAT1 reconstituted NFAT1−/− Th9 (RC) cells by Western blotting with α-NFAT1 antibody and α-lamin B (control). E and F, relative amount of IL-9 expression in the WT, NFAT1−/− (KO), and NFAT1 reconstituted NFAT1−/− Th9 (RC) cells was measured by qRT-PCR and ELISA, respectively. The data shown are expressed as mean ± S.E. (n = 3); **, p < 0.01.

