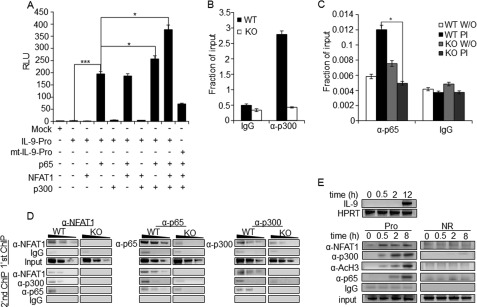
FIGURE 8.
NFAT1 mediates the recruitment of activation complex to enhance IL-9 promoter activity. A, HEK-293 cells were transfected with empty control vector (Mock), IL-9 promoter (IL-9 Pro), or mutant IL-9 promoter (mt-IL-9 Pro (mutations in both NT/κB1 and NT/κB1 sites)) reporter constructs in the presence of the indicated expression vectors. Cells were stimulated with PMA/ionomycin for 8 h and harvested for the luciferase assay. The luciferase activity was calculated relative to the activity of Renilla luciferase and represented in relative luciferase units (RLU) as a -fold difference relative to the control (mock/empty plasmid) value. The data represent mean ± S.E. (error bars) (n = 3); *, p < 0.05; ***, p < 0.001. B and C, ChIP assay was performed with Th9 cells differentiated from WT and NFAT1−/− (KO) mice using control IgG and p300 (B) and p65 antibodies (C). The amounts of precipitated DNA were measured by qRT-PCR with primers specific for the IL-9 promoter region and are represented relative to the amount in total chromatin (input) as a fraction of input. W/O, untreated. The data represent at least three independent experiments. The data represent mean ± S.E. (n = 3); *, p < 0.05; **, p < 0.01. D, ChIP-re-ChIP experiment. Th9 cells from WT and NFAT1−/− (KO) mice were stimulated with PMA/ionomycin and subjected to ChIP with either α-NFAT1, α-p65, α-p300, or control IgG antibodies (first ChIP), and the immunoprecipitates were eluted either with elution buffer or 10 mm DTT and proceeded with second ChIP with the indicated antibodies. The amount of precipitated DNA was then detected by qRT-PCR with the primer spanning the IL-9 promoter locus and is presented as negative images of the EtBr-stained gel. Data are representative of at least three independent experiments. E, Th9 cells were restimulated with PMA/ionomycin for the indicated time periods, and IL-9 levels were measured by qRT-PCR (top). The ChIP assay was performed with the indicated antibodies, and the relative amount of precipitated IL-9 promoter DNA was then detected by qRT-PCR and is presented as negative images of EtBr-stained gel (bottom). Data are representative of at least three independent experiments.

