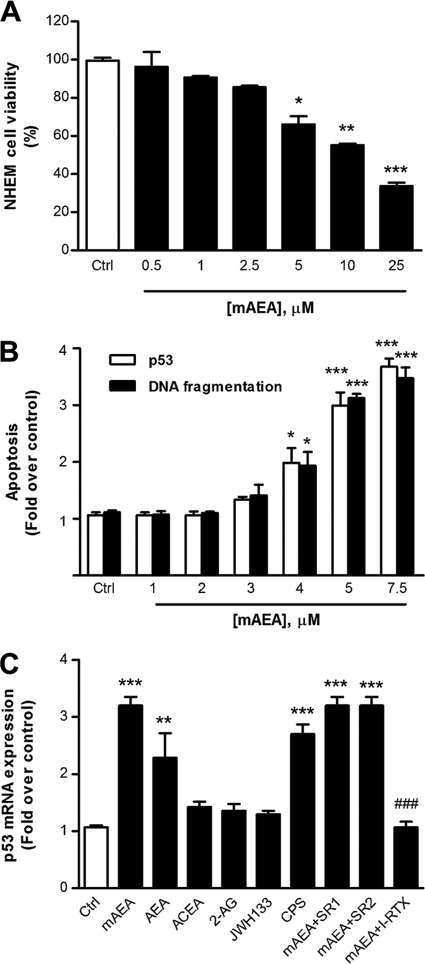
FIGURE 2.
Induction of NHEM cell apoptosis by mAEA and related compounds. The effect of different doses of mAEA on cell viability (A) and apoptotic cell death (B) is shown. C, effect of mAEA, AEA, ACEA, 2-AG, JWH133, or CPS (each used at 5 μm) and of mAEA (5 μm) in combination with SR141716 (SR1; 0.1 μm), SR144528 (SR2; 0.1 μm), or I-RTX (1 μm) on p53 mRNA expression. SR141716, SR144528, and I-RTX were ineffective when used alone (not shown for the sake of clarity). Error bars represent S.E. values. *, p < 0.05; **, p < 0.01; ***, p <0.001 versus control (Ctrl). ###, p < 0.001 versus mAEA.

