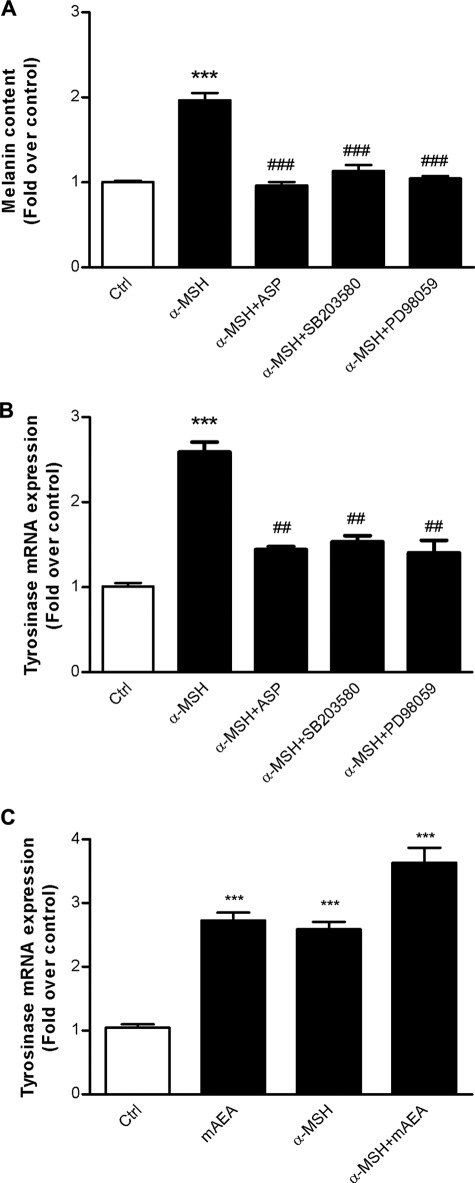
FIGURE 6.
Induction of melanogenesis by α-MSH. The effect of α-MSH (100 nm) alone or in combination with Agouti-related signaling protein (ASP; 10 nm), SB203580 (10 μm), and PD98059 (10 μm) on melanin content (A) and tyrosinase mRNA expression (B) is shown. C, effect of mAEA (1 μm), α-MSH (100 nm), and their combination on tyrosinase mRNA. Error bars represent S.E. values. ***, p < 0.001 versus control (Ctrl). ##, p < 0.05; ###, p < 0.001 versus α-MSH.

