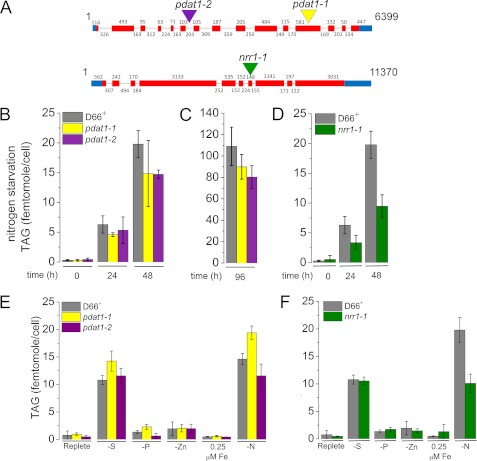
FIGURE 8.
Phenotype of C. reinhardtii strains carrying inserts in the PDAT1 and NRR1 genes. A, site of insert of AphVIII into genomic DNA in the PDAT1 and NRR1 mutants is indicated with a colored triangle (see supplemental Table 6 for exact position of inset). B, TAG content of pdat1-1 (yellow), pdat1-2 (purple), and the parent strain CC-4425 (D66+) (gray) measured at 0, 24, and 48 h after nitrogen starvation by quantitative gas chromatography as described under “Experimental Procedures.” C, TAG content of pdat1-1 (yellow) and pdat1-2 (purple) after 96 h of nitrogen starvation. D, TAG content of nrr1 (green) and the parent strain CC-4425 (D66+) (gray) measured at 0, 24, and 48 h after nitrogen starvation. E, phenotype of pdat1-1 and pdat1-2 mutants in other TAG-accumulating conditions (−PO4 and −SO4, 0.25 μm iron, and −zinc). F, phenotype of nrr1-1 mutants in other TAG accumulating conditions (−PO4 and −SO4, 0.25 μm iron, and minus zinc). Error bars represent standard deviation from three biological replicates except for C, which is from six biological replicates. Two-tailed Student's t test on the data indicate that pdat1-1 and pdat1-2 are statistically different from the parent strain after 96 h of nitrogen starvation at 93 and 99% confidence levels, respectively; nrr1-1 is also significantly different at 48 h of nitrogen starvation at 99% confidence.

