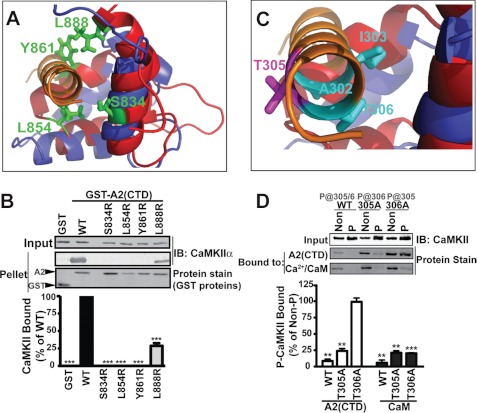
FIGURE 2.
α-Actinin mimics CaM in binding to the CaMKII regulatory domain. A and B, structural alignment of the A2-CTD (red) with the C-terminal lobe of CaM (blue) bound to CaMKII (from supplemental Fig. S2C). Residues in α-actinin-2 highlighted in green were mutated to arginine. Introduction of charge in the predicted hydrophobic binding pocket disrupted CaMKIIα binding, as seen by protein staining for GST proteins and immunoblotting (IB) for CaMKII. Binding is expressed as a percentage of binding to WT (mean ± S.E., n = 4. ***, p < 0.0001 versus WT; 1-way ANOVA, Bonferroni's post-test). C, close-up of CaMKII regulatory domain helix showing residues in CaMKII targeted for mutagenesis (cyan or magenta). D, effects of sequential autophosphorylation of WT, T305A-, or T306A-CaMKIIα (P) on binding to Ca2+/CaM or GST-A2-CTD. Levels of CaMKII in inputs were compared by immunoblot (top). Isolated complexes were analyzed by protein staining. Binding of autophosphorylated CaMKIIs was expressed as a percentage of binding of corresponding non-phosphorylated control CaMKII (mean ± S.E., n = 3. Two-way ANOVA, p < 0.0001. **, p < 0.001; ***, p < 0.0001 versus 100% by post-hoc 1-column t test).

