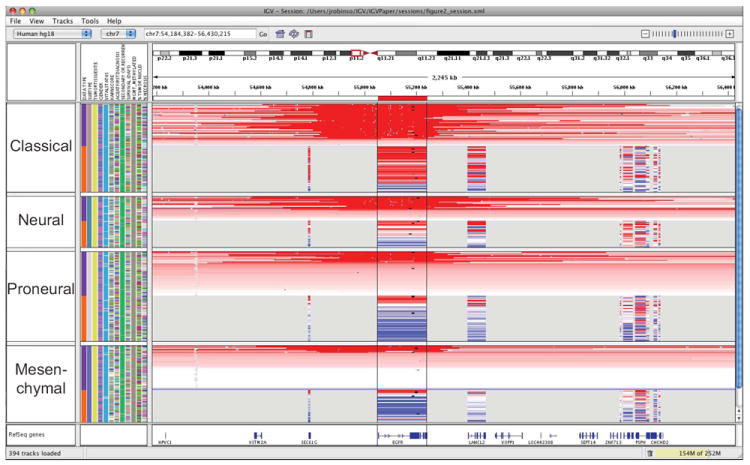
Figure 1. Copy number, expression, and mutation data grouped by tumor subtype.

This figure illustrates an integrated, multi-modal view of 202 glioblastoma multiforme TCGA samples. Copy number data is segmented values from Affymetrix SNP 6.0 arrays. Expression data is limited to genes represented on all TCGA employed platforms and displayed across the entire gene locus. Red shading indicates relative up-regulation of a gene and the degree of copy gain of a region; blue shading indicates relative down-regulation and copy loss. Small black squares indicate the position of point missense mutations. Samples are grouped by tumor subtype (2nd annotation column) and data type (1st sample annotation column), and sorted by copy number of the EGFR locus. Linking via sample attributes insures that the order of sample tracks is consistent across data types within their respective tumor subtypes.
