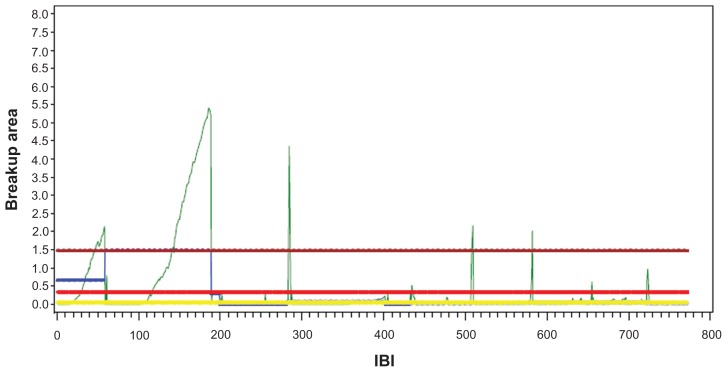
Figure 1.
Demonstrates data for one patient over 60 seconds of video.
Note: Mean breakup area is calculated as an average amount of corneal surface exposure over the entire video. The three long horizontal lines (from top to bottom) represent the maximum, mean, and medium MBA over the IBIs. The small blue line represents the MBA for the first IBI.
Abbreviations: MBA, mean breakup area; IBI, interblink interval.

