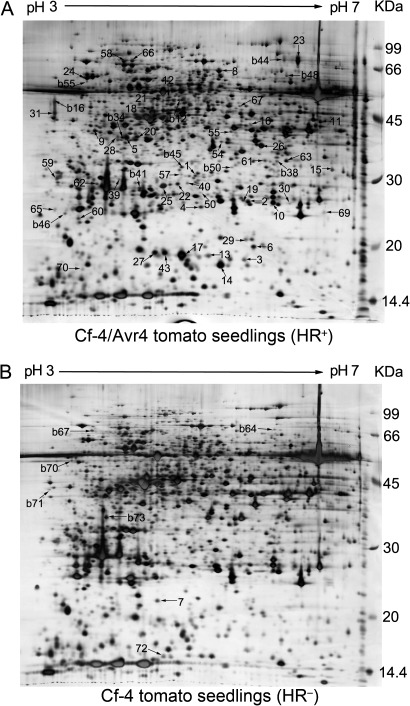
Fig. 1.
Two-dimensional polyacrylamide gel electrophoresis profiles of proteins from Cf-4/Avr4 tomato seedlings mounting a hypersensitive cell death (HCD). (A) Profile from Cf-4/Avr4 tomato seedlings (HCD+). (B) Profile from Cf-4 tomato seedlings (HCD−). A total of 300 μg protein per gel was loaded. After 2-D PAGE using IPG strips (24 cm, pH 3–7 NL), the gels were silver stained. Protein spots that expressed differentially over two-fold in the cotyledons of the HCD+ and HCD− seedlings are numbered and indicated with arrows in the gels in which the spots displayed with higher abundance. Spot numbers are as given in Supplementary Table S3.

