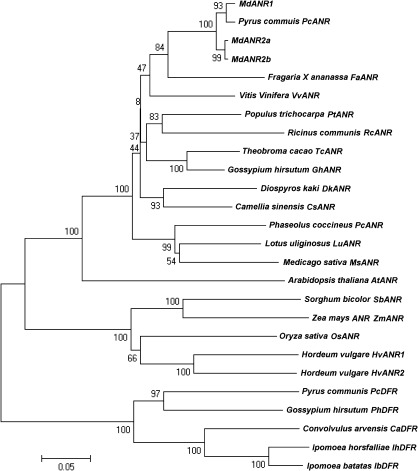
Fig. 3.
Phylogenetic tree derived from nucleotide sequences of genes encoding ANR and DFR in plants. The scale bar represents 0.05 substitutions per site, and the numbers next to the nodes are bootstrap values from 1000 replicates. The GenBank accession numbers are as follows: PcANR (DQ251189), FaANR (DQ664192), VvANR (XM_002271336), PtANR (XM_002317234), TcANR (GU324348), GhANR (EF187443), DkANR (AB195284), CsANR (AY641729), LuANR (EF197823), RcANR (XM_002518532), PcANR (BN000164), MsANR (HM754630), AtANR (NM_104854), HvANR1 (AK373696), HvANR2 (AK365124), OsANR (NM_001060512), SbANR (XM_002447113), ZmANR (BT064433), PcDFR (AY227730), IhDFR (GQ180935), IbDFR (EU402466), CaDFR (EU189076), and GhDFR (FJ713480).

