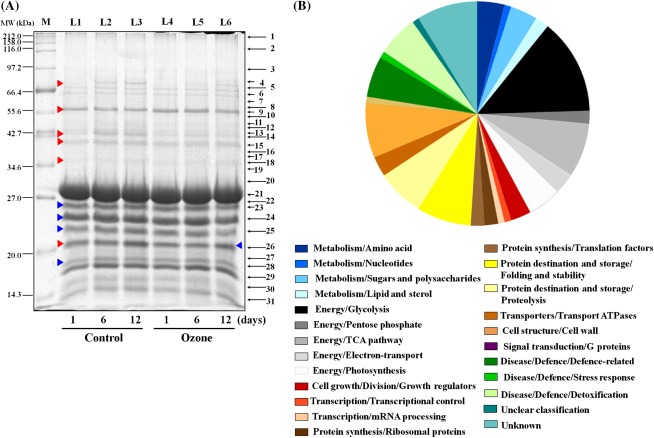
Fig. 6.
Characterization of kiwifruit (cv. ‘Hayward’) proteins during shelf life (20 °C) for 1, 6, and 12 days after cold storage (0 °C, 95% relative humidity) for 5 months in the absence (control) or presence of ozone (0.3 μl l−1). (A) Kiwifruit proteins (12 μg per lane) separated by 1D-SDS-PAGE and stained with Coomassie Brilliant Blue R250. For each treatment analysed, 1D-gels were run in triplicate. Protein zones were cut out, digested in gel using trypsin, and analysed by mass spectrometry and subsequent database searches. Lanes: M, molecular marker; L1–L6, kiwifruit proteins analysed at the indicated times. The localization of the protein zones (1–31) subjected to mass spectrometry analysis is reported on the right: the zones are labelled with the same numbers as in Table 1. Red and blue arrowheads indicate protein zones that were changed in abundance or carbonylated, respectively. (B) Functional categories of the identified kiwifruit proteins. The identified proteins were classified into various functional categories according to Bevan et al. (1998). The area for each category indicates the relative percentage of proteins in that category.

