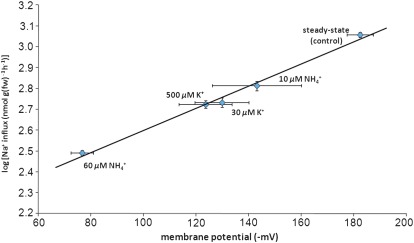
Fig. 4.
Relationship between membrane electrical potential and unidirectional Na+ influx, and in response to NH4+ and K+. NH4+ and K+ concentrations represent IC50 and IC75 values for the suppression of Na+ influx by these ions (see Fig. 2). Na+ fluxes were measured at 100 μM [Na+]ext. The data represent means of 4–23 replicates ±SEM. (This figure is available in colour at JXB online.)

