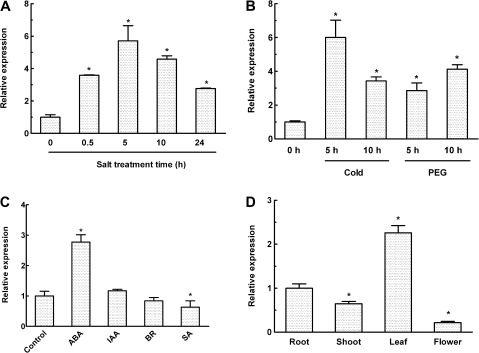
Fig. 2.
Real-time reverse-transcription (RT) PCR analysis for the expression of OsMYB2 in rice. (A and B) Time course of OsMYB2 expression during salt (A) and cold and PEG (B) treatments. (C) Expression of OsMYB2 under various hormone treatments. (D) Expression of OsMYB2 in different tissues. Total RNAs were prepared from 14-d-old seedlings of wild-type rice after the above treatments and then reverse-transcribed. The resultant cDNAs were used as templates for real-time RT-PCR and actin was used as an internal control. Data are mean±SE of three biological replicates. Asterisks indicate statistically significant differences (P < 0.05) from controls (0 h in A and B, root in D).

