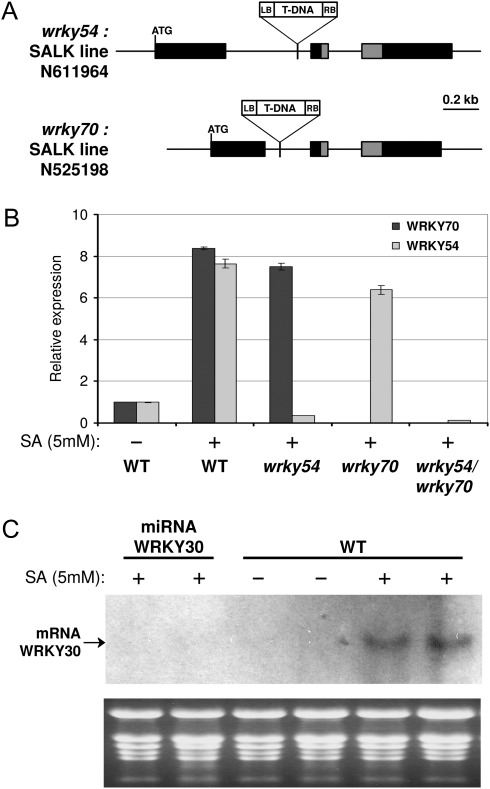
Fig. 4.
Characterization of WRKY transgenic lines. (A) Schematic representation of WRKY54 and WRKY70 gene structure indicating the location of T-DNA insertions. Exons are shown as dark boxes. The grey part indicates the region encoding the WRKY domain. (B) RT-qPCR analysis of WRKY54 and WRKY70 transcript levels in wrky54/wrky70 single and double mutants sprayed with 5 mM SA, compared with wild-type plants. Measurements were done 5 h after treatment. (C) RNA gel blot analysis of the WRKY30 transcript level in two independent miRNA-WRKY30 lines sprayed with 5 mM SA compared with wild-type plants. Measurments were done 5 h after treatment. EtBr (ethidium bromide) staining of the gel was used as loading control.

