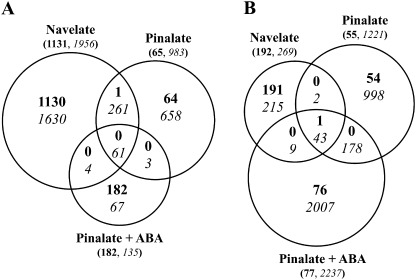
Fig. 2.
Venn diagrams showing differentially expressed genes (SAM analysis, FDR <0.01) in the flavedo of Navelate, Pinalate, and ABA-treated Pinalate fruits stored at 12 °C and 70–75% relative humidity for 1 (A) and 3 (B) weeks. Expression levels of upregulated (shown in bold) and downregulated (shown in italics) genes in these fruits were compared with those of FH fruits from each variety. Numbers in brackets are the sum of all induced (bold) or repressed (italics) genes under each particular condition. The sizes of the circles are shown relative to the total number of differentially expressed genes for each condition.

