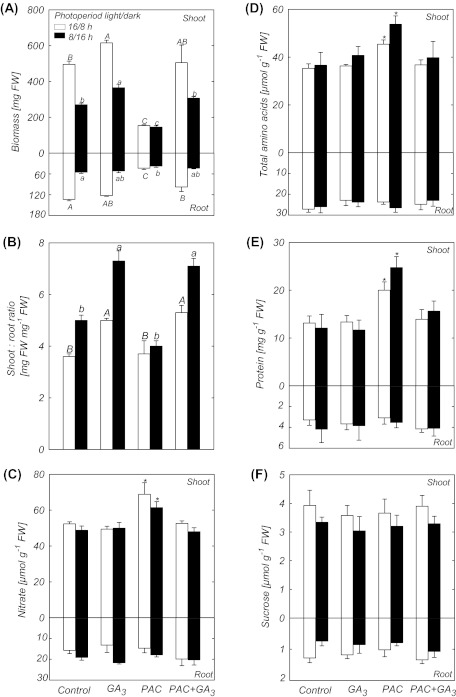
Fig. 5.
Comparison of the growth response and metabolite levels in shoots and roots of plants treated with PAC and/or GA3 in long and short photoperiods. (A) Biomass. (B) Shoot-to-root ratio. (C) Nitrate. (D) Total amino acids. (E) Protein. (F) Sucrose. Bars followed by the same upper case letter (long day) or followed by the same lower case letter (short day) do not differ significantly at the 5% level (Tukey test). Asterisks indicate values determined by the Student’s t-test to be significantly different from control (P < 0.05). Values are presented as means of six replicates (each replicate is a pool of five plants) ±SE.

