
Figure 4.
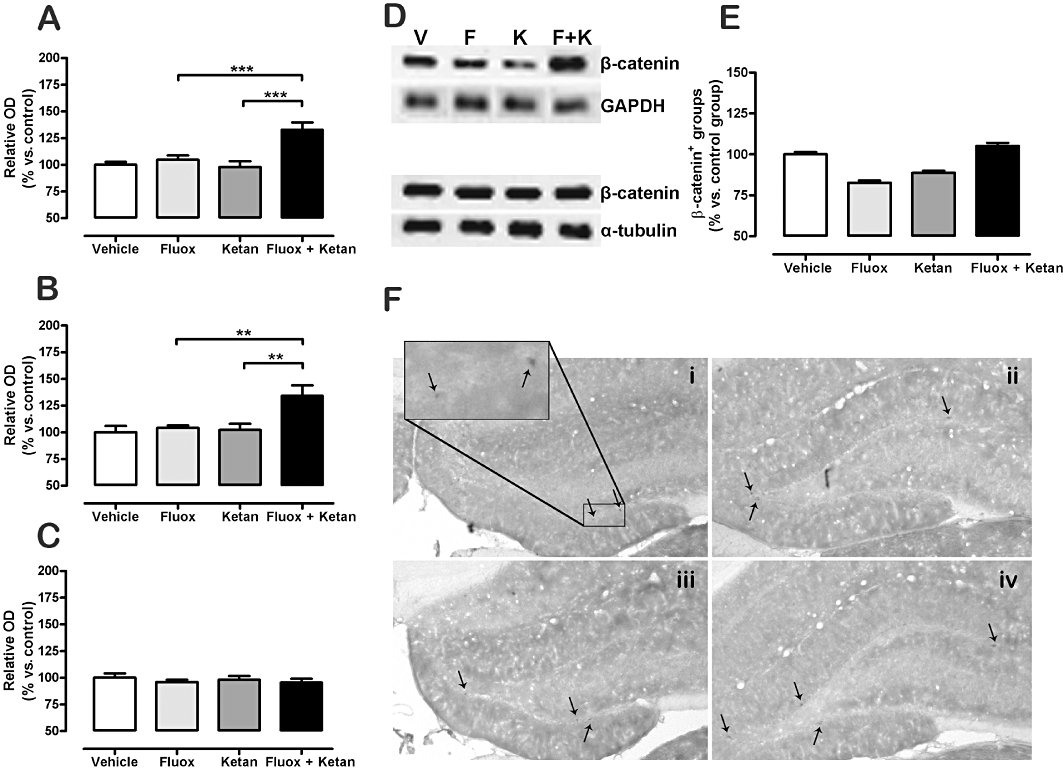
Effect of fluoxetine (Fluox), ketanserin (Ketan), and fluoxetine + ketanserin (Fluox + Ketan) treatments on β-catenin level in rat hippocampus TCL (A), membrane fraction (B) and nuclear fraction (C). Representative Western blots of β-catenin protein expression in membrane and nuclear fraction from hippocampus [vehicle (V), fluoxetine (F), ketanserin (K) and fluoxetine + ketanserin (F + K)] (D). β-catenin immunohistochemical positive clusters in the SGZ of the hippocampus (E) and representative images showing β-catenin immunolabelling in SGZ of the hippocampus (F): (i) vehicle, (ii) fluoxetine, (iii) ketanserin and (iv) fluoxetine + ketanserin. Western blot data are expressed as percentage of the relative optical density (OD) of the control, n= 10–12, and data for immunolabelling are presented as β-catenin immunopositive groups SGZ, n= 7 (vs. vehicle-treated animals). Data are presented as mean ± SEM Two-way anova for the antidepressant fluoxetine × ketanserin interaction in TCL [F(1,44) = 9.14, P < 0.01], membrane fraction [F(1,44) = 4.65, P < 0.05] and β-catenin immunolabelling [F(1,24) = 36.28, P < 0.001]. **P < 0.01, ***P < 0.001 in the Bonferroni post hoc test.