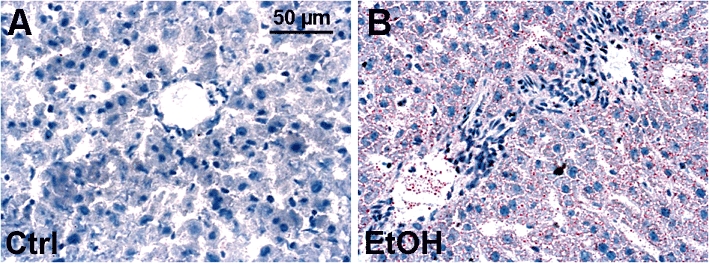
Figure 1.

Oil red O staining of lipid droplets after acute alcohol exposure. Lipid deposition after ethanol gavage was analyzed by Oil red O staining. Left figure (A) depicts livers of saline-gavaged rats (ctrl), right figure (B) depicts livers of ethanol-gavaged rats (EtOH). Tissues were collected 12 h after saline or ethanol gavage. Representative Oil red O stained liver sections are shown; bar is 50 µm.
