
Figure 3.
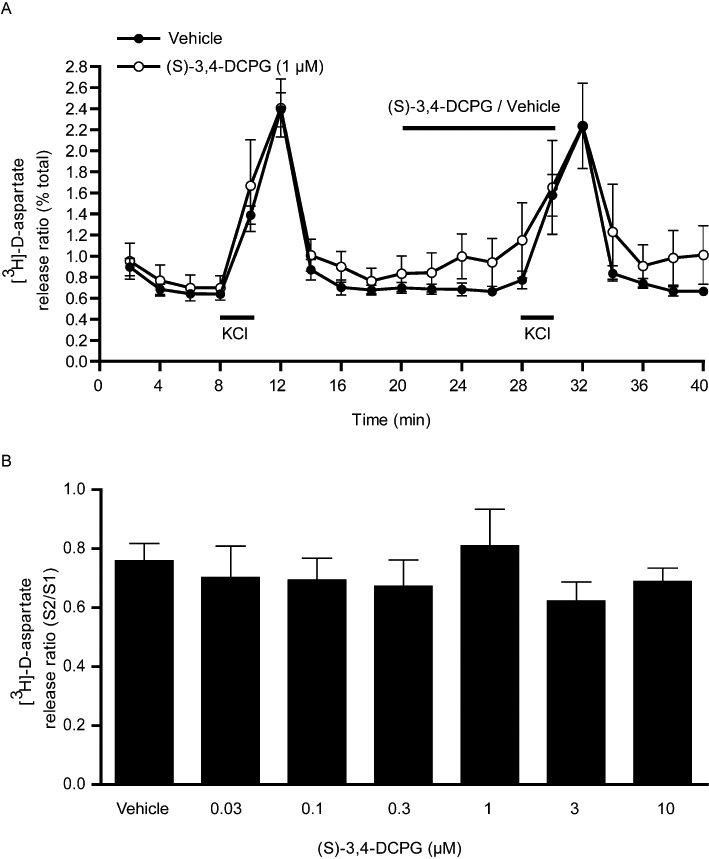
Effect of the mGlu8 agonist (S)-3,4-DCPG, on 25 mM KCl-evoked [3H]-D-aspartate release in rat nigral tissue prisms. (A) Release profile showing the effect of (S)-3,4-DCPG (1 µM) on release evoked by the second KCl stimulus (S2). Horizontal bars indicate the periods of contact with KCl or drug/vehicle. Data are mean ± SEM (n= 3 from a single experimental run). (B) Graph of S2/S1 ratio showing lack of effect of increasing concentrations of (S)-3,4-DCPG on [3H]-D-aspartate release. Data are mean ± SEM (n= 6).